Architecture
Grafana-Architecture
System Overview
Grafana 12.0.2 is a comprehensive observability platform that provides visualization, alerting, and analytics capabilities for time-series data. The architecture follows a modular design with the following core components:
Core Components
-
Grafana Server: Main application server handling web interface and API
-
Database Layer: PostgreSQL/MySQL for metadata and configuration storage
-
Alerting Engine: Unified alerting system with rule evaluation and notification
-
Data Sources: Connectors to various data systems (Prometheus, InfluxDB, etc.)
-
Plugin System: Extensible plugin architecture for panels and data sources
-
Authentication Layer: Multi-provider authentication and authorization
Architecture Diagram
┌─────────────────┐    ┌─────────────────┐    ┌─────────────────┐
│   Load Balancer │────│   Grafana Web   │────│   Grafana API   │
│     (Nginx)     │    │     Server      │    │     Server      │
└─────────────────┘    └─────────────────┘    └─────────────────┘
                                │                       │
                       ┌─────────────────┐    ┌─────────────────┐
                       │   Database      │    │   Data Sources  │
                       │ (PostgreSQL)    │    │ (Prometheus,    │
                       └─────────────────┘    │  InfluxDB, etc) │
                                              └─────────────────┘
                                                      │
                       ┌─────────────────┐    ┌─────────────────┐
                       │ Alerting Engine │    │ Plugin System   │
                       │                 │    │                 │
                       └─────────────────┘    └─────────────────┘
Technology Stack
-
Runtime: Go 1.21+ (backend), Node.js 18+ (frontend build)
-
Database: PostgreSQL 12+ / MySQL 8.0+ / SQLite 3.x
-
Frontend: Angular/React components with TypeScript
-
Container: Docker 24.x
-
Orchestration: Kubernetes 1.26+ (optional)
-
Caching: Redis 7.x (optional)
Key Features
-
Unified Alerting: Advanced alerting with multiple notification channels
-
Correlations: Link metrics across different data sources
-
Public Dashboards: Share dashboards without authentication
-
Canvas Panels: Advanced custom visualizations
-
AI-Powered Insights: Machine learning-based anomaly detection
Metrics For metrics we use NodeExporter > Prometheus > Grafana approach
-
We install Node Exporter agent in the target servers.
-
We use prometheus to scrape metrics at managed frequency and store in the path that was declared.
-
Then we integrate Grafana with prometheus by adding it as data source. We build dashboards to visualize the metrics in Grafana.
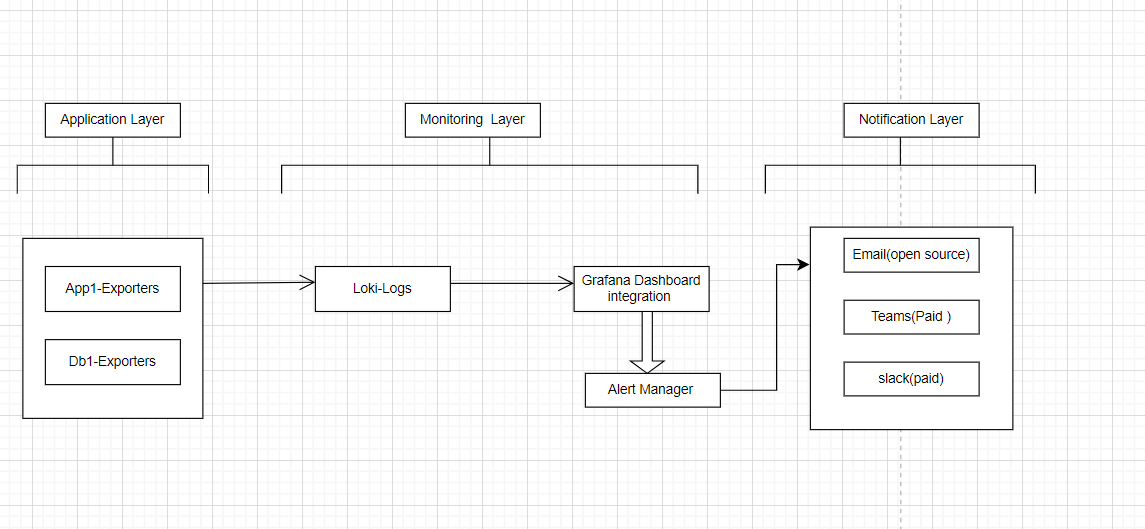
Logs For Logs we use promtail > Loki > Grafana
-
We need to install promtail agent in the target servers.
-
We use Loki to store the data that was pushed by promtail by attaching time-series metadata in the mentioned storage space.
-
Integrate Grafana with Loki by adding it as a data source. We use PromQL language to query logs depending on the need.