Dynamic Visualization
1. Introduction
Dynamic Visualization is an AI-powered data analysis tool inside DPL Suite that allows users to:
- Connect to multiple data sources
- Automatically generate charts and insights
- Perform analysis using natural language
- Build dashboards without manual coding
- It uses AI models (like GPT/Claude) to understand your data and suggest meaningful visualizations.
2. Enabling Dynamic Visualization
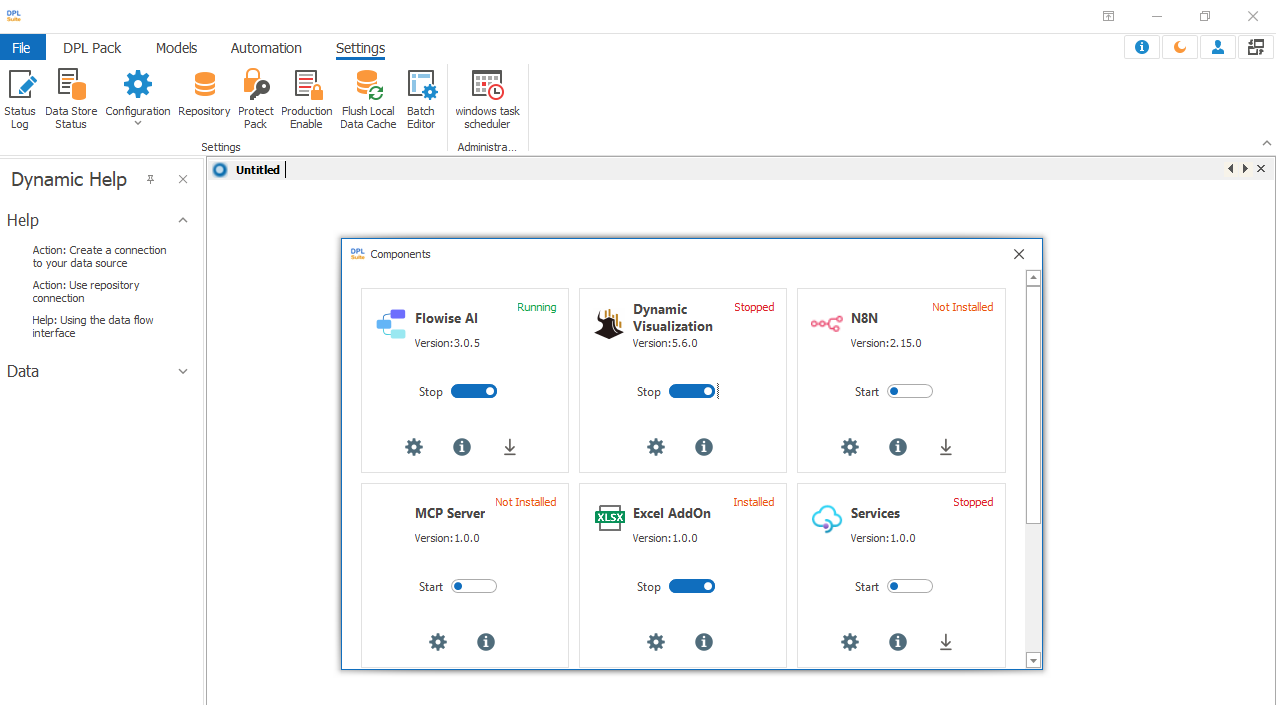
Before using the tool, the Dynamic Visualization service must be running. This is a backend component that powers the UI and AI processing.
Steps:
- Open DPL Suite
- Go to Settings
- Click Configuration → Component
- Locate Dynamic Visualization
What to check
- Status should be Running
- If not → Click Start
Without this step, the visualization app will not open
3. Launching the Application
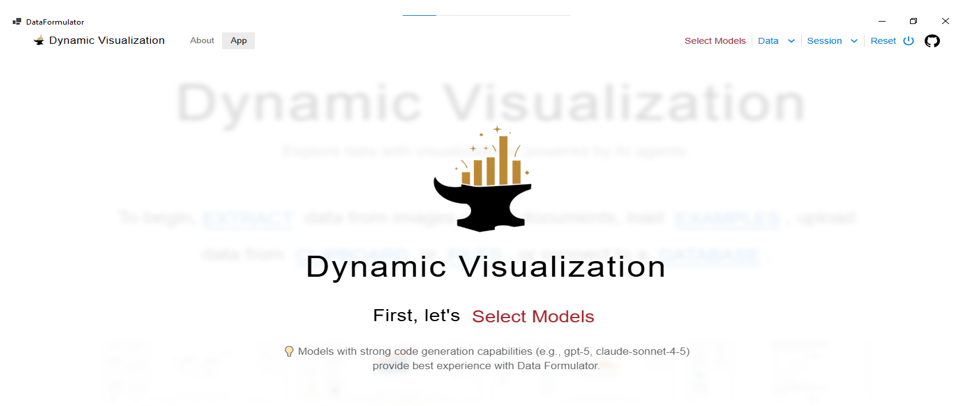
Dynamic Visualization is accessed through the Automation layer, which acts as the execution environment for tools.
Steps:
- Go to Automation tab
- Click Dynamic Visualization
This opens the Data Formulator interface
4. Selecting AI Model (Important Step)
The tool depends on an AI model to:
- Generate charts
- Understand your data
- Answer questions
Without configuring a model → App won’t function properly
Steps
a. Click Select Models (top-right)
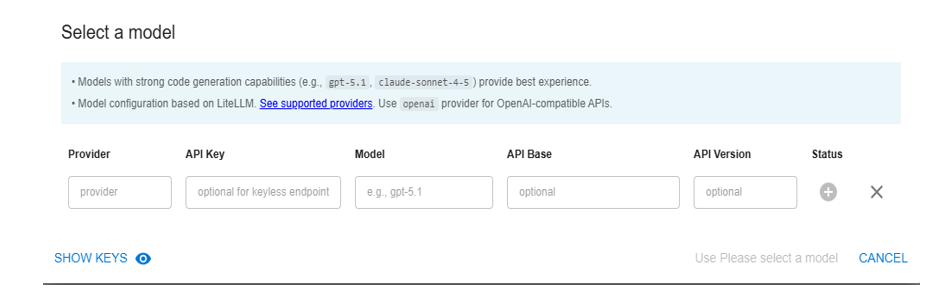
b. Fill the fields:
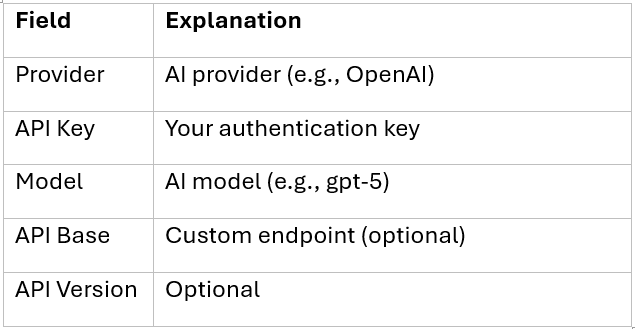
c. Click + (Add)
d. Click Use
Recommendation
Use:
- GPT-5 → Best for complex analysis
- Claude Sonnet → Good for structured reasoning
5. Understanding the Dashboard
This is your main working area, where you:
- Load data
- Generate visualizations
- Explore insights
Key Sections
Data Input Options:
- EXTRACT → From images/documents
- UPLOAD FILE → CSV/JSON
- CLIPBOARD → Paste data
- DATABASE → Connect live data
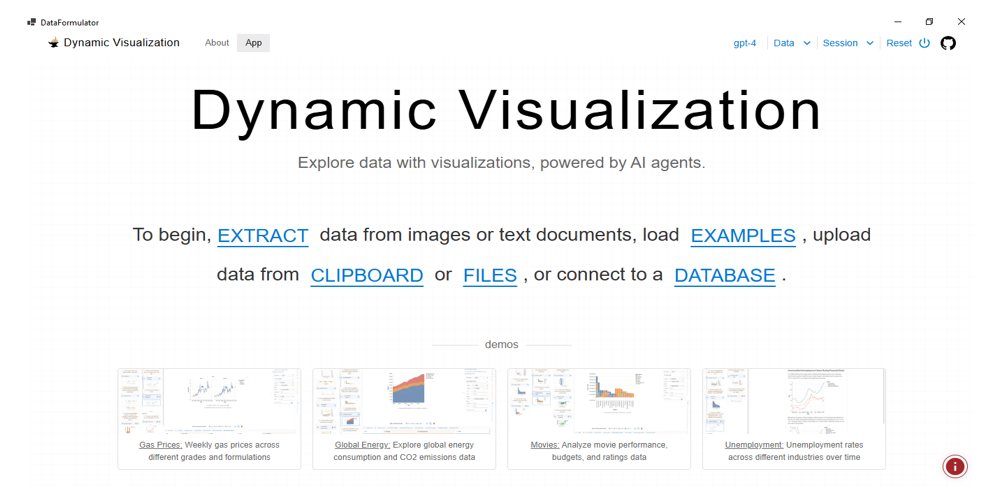
Demo Section
Preloaded examples to practice visualization
6. Loading Data
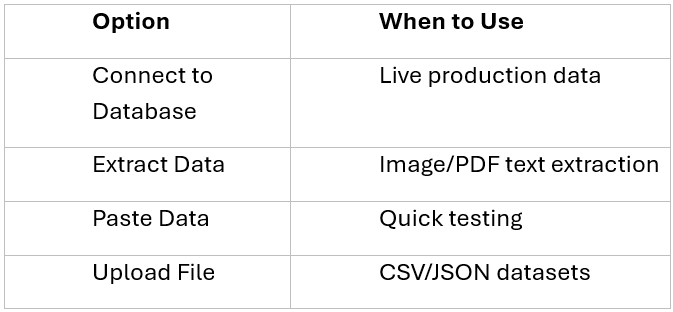
Data is the foundation of visualization. You must load data before any chart or insight can be generated.
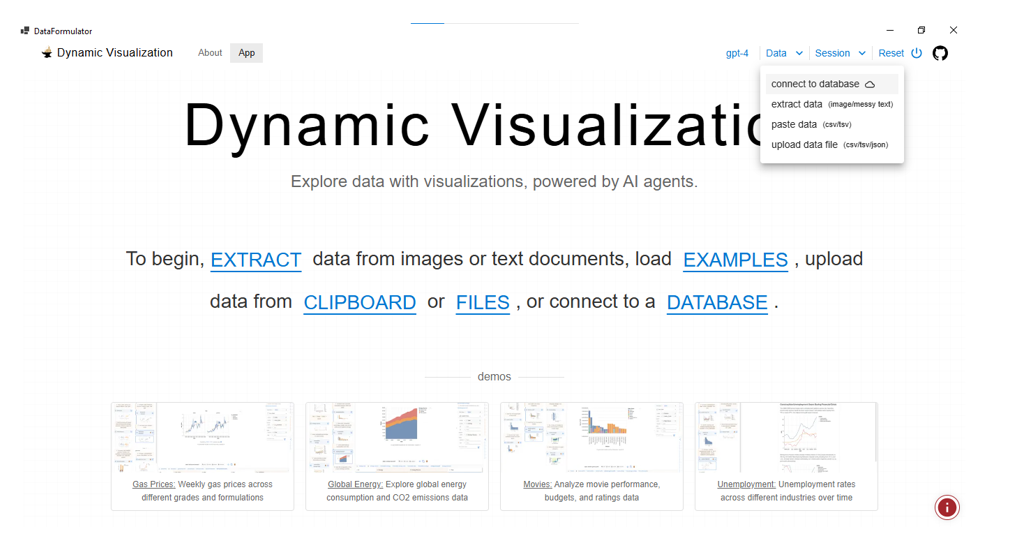
Steps:
- Click Data (top menu)
- Choose one option:
7. Connecting to Database
Database connection allows you to:
- Work with real-time data
- Perform live analytics
- Avoid manual file uploads
Supported Databases
- MySQL
- MSSQL
- PostgreSQL
- MongoDB
- BigQuery
- Azure Blob
- S3
- DPL Connector
8. Using DPL Connector
DPL Connector is used when your data is inside a DPL Pack.
Steps:
a. Select DPL Connector
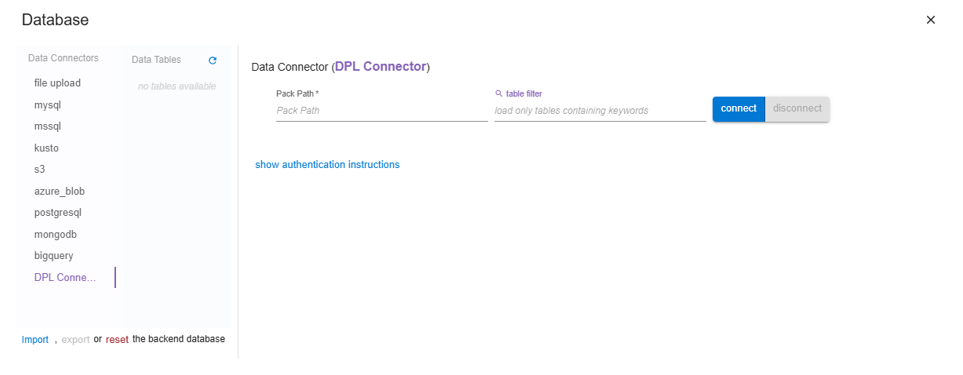
b. Enter:

c. Click Connect
What Happens Next
- System reads pack
- Tables are loaded
- Data becomes available for visualization
9. Visualization Workflow
Once data is loaded, AI starts working automatically.
Process:
- Data schema is detected
- AI analyzes patterns
- Suggested charts appear
You can:
- Ask questions (e.g., “Show monthly trend”)
- Generate: Bar charts, Line charts, Trends, KPIs
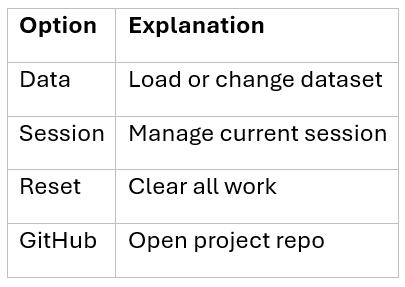
10. Session Controls
Located at top-right
11. Example Use Cases
- Business dashboards
- Energy / IoT monitoring
- Anomaly detection
- Sales analysis
- AI-assisted reporting
12. Best Practices
- Use clean, structured data
- Avoid missing/null-heavy columns
- Use meaningful column names
- Choose a strong AI model
- Start with sample data for testing