Packages
DPL Studio Packages
DPL Studio packages are the core working files used within DPL Studio. All work performed in DPL Studio is managed inside a DPL package, which is a single file containing:
- Data Connections
- Queries
- Export Templates
All components within a DPL package can communicate with one another, share data, and function together as a unified system.
Sample Package
For example, consider an inventory package named inventory.DPLpack, designed to manage inventory ordering.
This package may contain:
- Connections to inventory and sales databases on a corporate server
- Multiple queries
- Several export templates that share common data
Example Export Templates
Product Inventory Template
Retrieves current inventory details from the inventory database.
Quarterly Sales by Product Template
Retrieves product sales information from a sales database view.
Inventory Needs Export Template
Uses data from both inventory and sales templates to:
- Calculate items sold during the quarter
- Compare them with available inventory
- Determine what products need to be reordered
This demonstrates how multiple components within a DPL package work together to process and share data efficiently.
Data Flow Graph
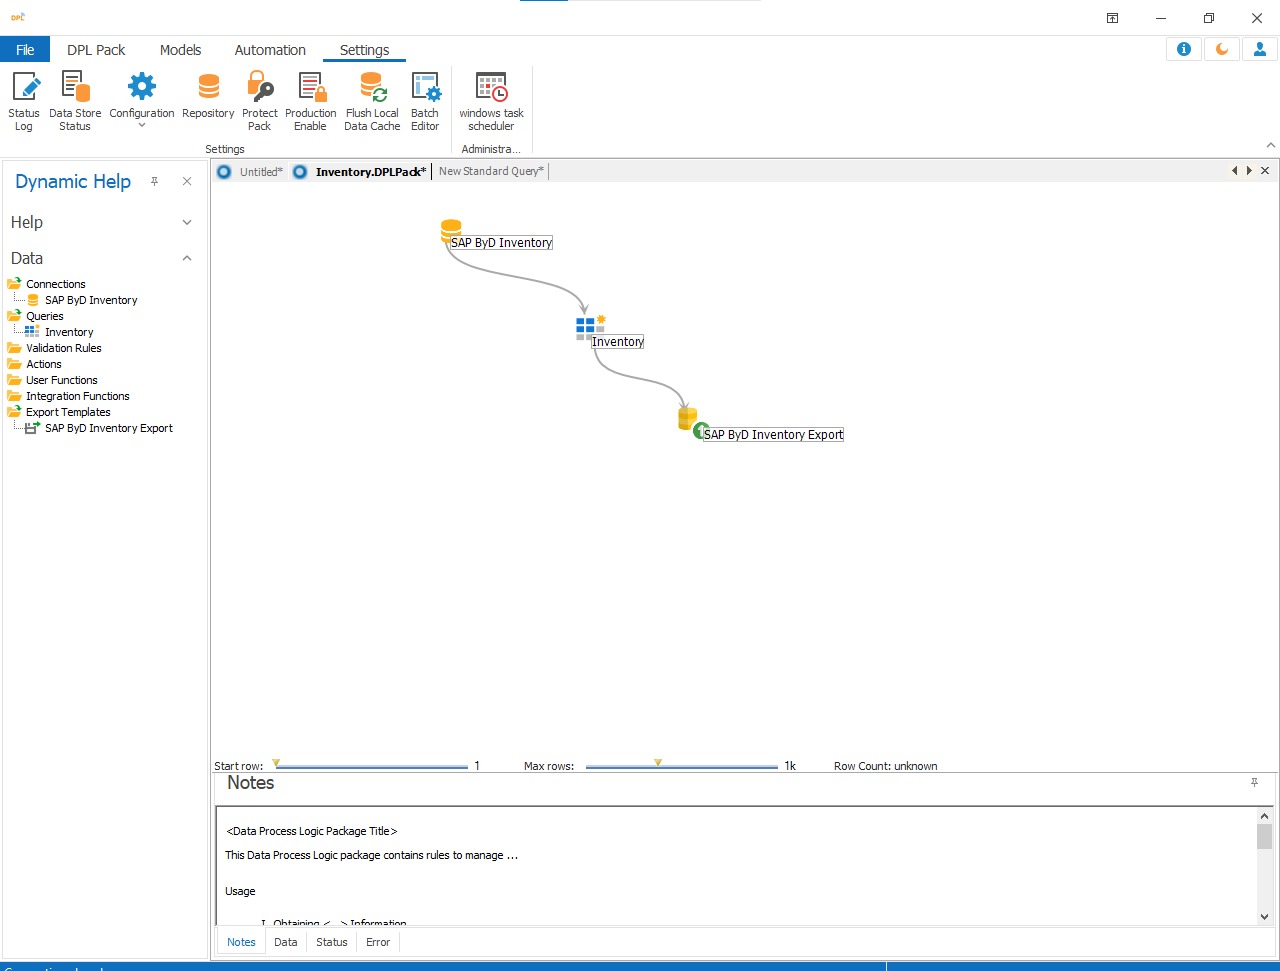
The Data Flow Graph visually represents the structure and hierarchy of a DPL package. It helps users understand how data moves throughout the project.
As DPL packages become more complex, the Data Flow Graph becomes an important tool for:
- Visualizing workflows
- Understanding data movement
- Diagnosing issues within the package
DPL Package Editor
When a new DPL package is created or an existing package is opened, the DPL Package Editor is displayed.
The editor contains two main sections:
Data Flow Graph (Top Pane)
Displays nodes and workflow hierarchy.
Preview Pane (Bottom Pane)
Displays:
- Output sample data
- Error messages
Nodes in the Data Flow Graph
Each item displayed in the Data Flow Graph is called a Node.
- Nodes are automatically created or removed as the package is modified.
- DPL Studio automatically determines a suitable location for newly created nodes.
- Nodes can also be manually repositioned by clicking and dragging them within the document area.
Viewing Query Results
To view query output within the Data Flow Graph:
- Right-click the query node
- Select View Data
Alternatively:
Double-click the query node to open the data preview.
Preview Controls
The Preview Pane provides:
- Start Row Slider : Controls the starting row of displayed data.
- Max Row Slider : Controls the maximum number of rows displayed in the preview pane.